


On the heels of the release of part one of its “Consumers Tell All” survey, Bronto Software has released the second edition—on the device of choice for online shoppers.
Mobile devices have given consumers the ability to shop when and where they wish, and the power to look for the best deal possible, whether online or in a brick-and-mortar store. So, more and more consumers now expect a seamless shopping experience between sites and stores.
To get a better understanding of what else consumers expect and prefer, Bronto and Ipsos asked 1,012 U.S. consumers about the devices they own and how they use them when shopping and purchasing. Here, their responses.
Device ownership by:
Preference
Mobile device adoption is on the rise, of course, but the study found that desktop and laptop computers continue to be the most owned devices by online shoppers; however, ownership has declined since the last study—4% for desktops and 2% for laptops. On the other hand, tablets and smartphones exceeded the 50% ownership threshold for the first time, while smartphone ownership jumped 12% and tablet ownership was up 13%.
Age
There was a split in preferred device among age groups: Laptops are the most popular device for online shoppers under 65; respondents over 65 are more likely to own a desktop. The second most owned device for shoppers under 40 is a smartphone, while shoppers between the ages of 40 and 65 have desktops as second. In addition, Bronto’s previous study found that tablets were more popular with seniors than smartphones; this trend has shifted, as the percentage of seniors who own tablets jumped from 35 to 41% and smartphones from 26 to 43%.
Region
When analyzed by region, a few differences emerge. Online shoppers in the northeast are more likely to own a tablet than shoppers in the rest of the nation, and those in the west are more likely to own a smartphone.
Gender
Males showed a stronger preference for shopping and buying on mobile devices. Such activities for males were 3% higher than their female counterparts. Tablet preferences were slightly more dramatic; 5% more men preferred shopping on tablets than women, and 6% more men prefer buying on tablets.
Mobile versus apps
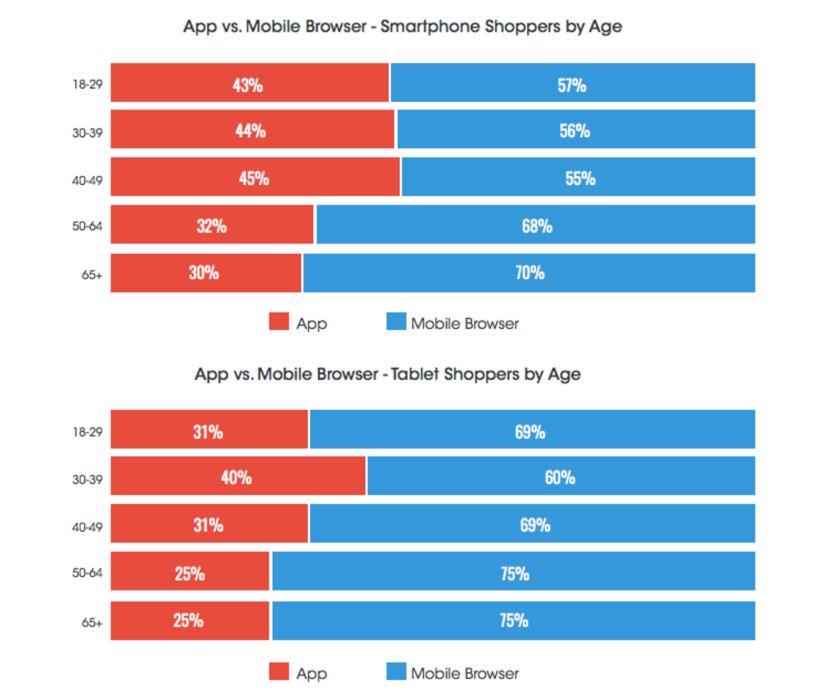
Engagement and interaction using mobile Web browsers and apps vary significantly between smartphones and tablets. Respondents were asked which experiences they prefer for online shopping; both smartphone and tablet shoppers cite mobile Web browsers as preferred over apps, with 61% of smartphone shoppers preferring mobile Web browsers and only 39% for apps. For tablet shoppers, mobile Web browser preferences were even stronger at 69%.
Female online shoppers showed the strongest preference for mobile browsers on both smartphones and tablets, with 76% of the group preferring to use mobile browsers and only 24% preferring apps.
The closest split between apps and mobile browsers was for male smartphone shoppers, who were nearly evenly split, with 45% preferring apps and 55% preferring mobile browsers.
When analyzed by age, smartphone shoppers under the age of 40 share similar preferences, as more than half use mobile browsers. Smartphone shoppers over 50 are even more comfortable with mobile browsers, with 68% of 50 to 64 year olds and 70% of the 65-and-up group rank mobile browsers over apps.
Tablet shoppers between the ages of 30 and 39 boast the strongest app preference, and also have the highest rate of tablet ownership at 59%. When tablet shopping is juxtaposed with smartphone shopping, online shoppers ages 18 to 29 and 40 to 49 show the most variation across devices. Twelve percent more of the 18- to 29-year- olds would prefer a Web browser when tablet shopping, and 14% more 40- to 49-year-olds prefer a Web browser when tablet shopping.


