


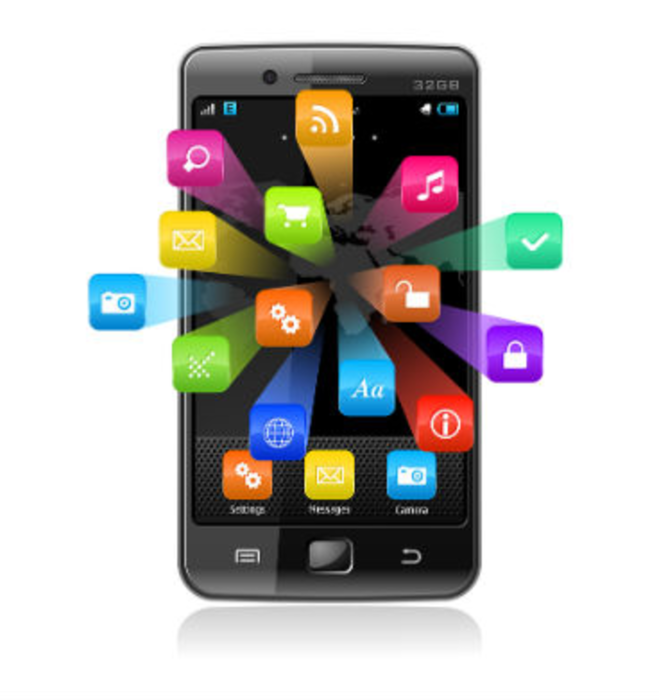
It’s no secret that mobile has become a global form of communication. Flashing a smile has been replaced with sending an Emoji and lengthy tête-à-têtes have been confined to texts and tweets.
In fact, according to an International Data Group (IDG) Global Solutions study of more than 21,000 people worldwide, 77% of respondents claim to have a smartphone and 50% claim they have or use a tablet. The IGS 2012 Mobile Survey was conducted from March to May 2012 and surveyed people who visited at least one of IDG’s 124 websites, many of whom worked in IT (32.67%) or were male (84%). This is the third consecutive year IDG has conducted the survey dedicated to unraveling the mobile motives of the techies.
While 94% of respondents say they still use their smartphone to make an old-fashioned phone call, a high percentage also use their phones as more than just, well, a phone. Eighty-four percent of respondents say they use their smartphone for texting, 69% use their phone to browse the Internet or to check email, and 32% glue their eyes to the mini screen to play games.
What’s more, consumers are using their mobile devices to give other household gadgets the old heave-ho. In fact, 65% use their smartphone instead of the alarm clock, 35% apply their smartphone to forgo their landline phone, 52% use it to ditch their music player, and 62% have tossed out the morning paper in place of a tablet. Functionality also beat out battery power, cost, and brand reputation when it came to the percent of respondents who listed a particular factor as first, second, or third most vital.
Users also appear to be quite picky when it comes to their preferred mobile operating system. Forty-four percent prefer to use iOS for iPhone followed by 34% who ranked Android as their operating system of choice; Windows Phone was next in line with a 7% preference rate.
So when’s the best time for tech companies to target these mobile users? According to the study, 57% of respondents say that they’re most likely to view technology content after business hours and 48% deem the weekend as the optimal time. And those in IT know what they want to see; when it comes to video, 56% of respondents prefer to see technology product reviews and 45% would like to see career-related segments.


