


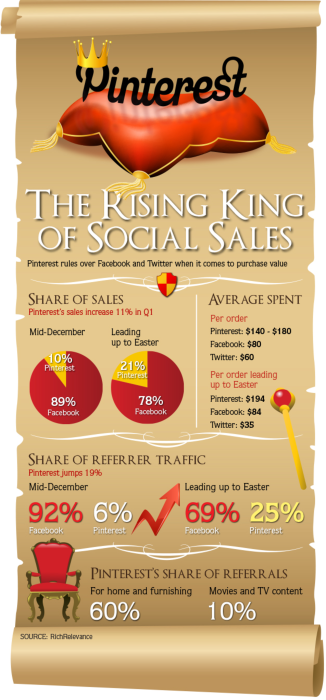
When it comes to driving sales, Pinterest reigns supreme in the social kingdom. It’s also growing in areas where other social networks are losing ground. According to the data gathered by RichRelevance, a personalized commerce provider that analyzed browser-based shopping sessions on U.S. websites using RichRelevance’s retail recommendation software, while Facebook accounted for 92% of the surveyed websites’ share of referrer traffic in mid-December, the social network’s share of traffic rates plummeted to 69% the week before Easter. Contrastingly, Pinterest’s started at a meager 6% in mid-December and shot up to 25% before the Easter holiday.
RichRelevance’s data indicates that Facebook is also losing its crown when it comes to share of sales. Facebook boasted an impressive 89% share of sales in mid-December compared to Pinterest and Twitter; yet its share of sales figures fell to 78% by the time the candied eggs and Peeps rolled in. However, Pinterest’s share of sales jumped from 10 to 21% within that same duration. Pinners also appear to spend more than Twitter followers and Facebook users alike. According to the data, Pinterest shoppers spend approximately $140 to $180 per order, while Facebook shoppers spend about $80 per order and Twitter shoppers ring up $60 orders. This difference in shopping carts was highlighted the week leading up to Easter, as Pinterest shoppers forked over an average of $194 per order compared to $84 and $35 for Facebook and Twitter, respectively.
But if Pinterest wants to hold onto its sales crown, it will need to enhance its share of referrals. While Pinterest’s share of home and furnishings shopper referrals accounted for 60% of all social referrer traffic, its share of movie and TV referrals only accounted for 10%.
We know you love infographics. Check out some more Direct Marketing News originals.