Content marketing, the strategy of creating and distributing media that supports a product or service message, has become a go-to strategy for connecting with customers. Content has become more than king and queen. It’s the entire court. When you’re using media, of course, you have to deploy analytics to know if it is effective. But where to start?
The best starting point come from reports that focus on referral sources and curation–sharing content from other sources that have similar interest to that of your business. These reports and feature can help frame initial metrics that can be carried into analytics decisions of all scales, from basic to advanced business intelligence tactics.
The suggestions below are based on Google Analytics reports. However, variations of the mentioned reports and features are available in other analytic solutions such as Adobe Analytics and Webtrends.
Start With Affinity Reports and Content Grouping
A content marketing strategy should start with a review of topics that are drawing people to a site or app. The affinity reports can assess what interest exist among site and app users. The reports look at interest among consumers at the beginning of a sales funnel–those who are investigating a product or service. The similarly structured In-market reports display topics of interest for visitors who were likely to purchase.
The default categories in the reports include media-influenced labels such as TV Lovers, Music Lovers, News Junkies and Shutterbugs. These categories can spark ideas as to what media would be best associated with the content on your site.
Another aid is the Content Grouping feature. This protocol allows marketers to set metrics for a set of content that is expected to be associated together. Setting up the Content Grouping requires modifying the main analytics tag in Google Analytics Tag Manager.
Plan How Content is Measured
Next, marketers can see how far videos and posts influence traffic arriving at a site or driving conversions. Doing so involves embedding a URL tag to URLs that appear in paid search ads and social media posts. Labeling involves using a URL tag builder, with naming that highlights the source of media, the advertising network on which the ad appears, and name of the campaign. Marketers can create a matrix to keep track of the campaign schedules.
Marketers can also do the same with ads linked to social media. To learn about ad options, check out my previous post on using social media ads.
Plan Reporting that Reflects Content and Traffic Metrics
Reports should reflect engagement metrics associated with content and referral sources that appear when content is distributed. Content pages reports, for example, allow an analyst to rank content by visits to a given page. A secondary way to rank pages is to look at average time in session and page value. The average time in session reflects a degree of engagement–the readers are spending time on the page. Page value will indicate which pages are contributing to conversions, which means the content has value towards driving users to an objective set in the analytics, like a whitepaper download or a registration.
Another assist can come from monitoring referral traffic reports, such as the Network Referrals report for social media. It allows a comparison of which social media network is influencing engagement, letting marketers focus budget on the social media that is yield response.
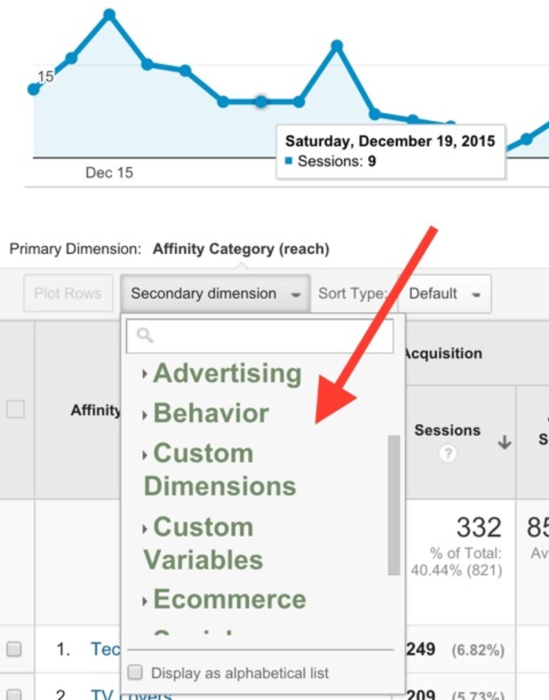
Second Dimension Leads To Second Choices
Many reports in Google Analytics include a drop-down menu for selecting a second dimension in the reporting table. The second dimension menu inserts another condition for ranking the dimensions in a given report. When reviewing Affinity reports, a few second dimension choices can be helpful. One selection is device. Using device as a second dimension can augment ideas for tailoring content to devices that visitors will likely access.
This can be combined with the customer journey tool, filling in another piece of the multichannel puzzle.
Another is age. Selecting age as a second dimension in the Affinity Report shows if the site or app is attracting the intended age group.
The third second dimension idea is time. Time can give ideas on when content should be planned by day or by hour, for example. So ads that are meant to attract social media enthusiasts may be better planned for Monday and Tuesday mornings, while ads with a tone appropriate for news junkies would prefer an evening appearance later in the week.
Look for Trends over Different Periods
To tease out trends from the data, marketers should review the data in 30-day, 60-day, and 90-day increments to see if certain pages are consistently ranking well. Those performing consistently pages are evergreen content.
Evergreen content is a reflection of ongoing interest. Marketers can plan subsequent content based on the topics that seems to have worked for those posts.
Marketers should keep in mind that as most content marketing metrics tie into three aspects–reach, consumption, and conversion. It’s easy to overvalue metrics on reach and consumption (blog page views and retweets, for example) and undervalue the metrics associated with conversion (email subscriptions, downloads, and online sales from a button click). Build reports that help highlight trends that influence conversions and lead to better and valuable decisions.
Ultimately analytics reports can guide how content should evolve over time to appeal to customers. Social sharing and campaign results are important, but the campaign should always serve content that distinguishes your brand from its competitors in effectively engaging customers.